Construction project controls, consulting, and In Project AI
Best Dashboards for Construction Project Managers: 9 Views Every PM Needs
A practical guide to the nine construction dashboards that matter most: budget forecast, change exposure, schedule, risk, RFIs and submittals, weekly reporting, owner reporting, earned value, and closeout. Includes KPIs, update cadence, and real examples.
Article summary
A practical guide to the nine construction dashboards that matter most: budget forecast, change exposure, schedule, risk, RFIs and submittals, weekly reporting, owner reporting, earned value, and closeout. Includes KPIs, update cadence, and real examples.
Introduction
Most construction teams do not have a data problem. They have a visibility problem. The budget lives in one spreadsheet, the schedule in another tool, RFIs and submittals in a project management platform, and the real story of the job in meeting notes and email. A good dashboard pulls the few signals that matter out of those sources and puts them in front of the person who has to make a decision.
This guide walks through the nine dashboards that consistently earn their place on commercial and institutional projects. For each one you will find what it should show, which KPIs matter, who reads it, how often it should be updated, and the mistakes that make it misleading. The examples come from real In Project dashboards and sanitized In Project AI reports, so you can see what a working version looks like.
If you only have time for three, start with the budget forecast, change exposure, and schedule dashboards. Those three explain most of the cost and time surprises owners and executives complain about.
What makes a construction dashboard useful
Before choosing charts, decide what decision the dashboard supports. A dashboard that tries to show everything ends up showing nothing. The best ones share five traits:
- It answers one management question. For example: Will we finish within the approved budget? Which RFIs are about to delay the field?
- It separates approved from pending. Approved changes, pending exposure, and potential risks belong in different columns. Mixing them hides the real forecast.
- Every red or yellow status can be explained. If a status turns red, the reader should see the line items driving it, the owner, and the next action.
- It updates on a reliable cadence. A weekly dashboard updated every third week trains people to ignore it.
- It shows movement, not just a snapshot. The forecast changing by $180,000 since last month is more important than the forecast itself.
The table below summarizes the nine dashboards covered in this guide.
| Dashboard | Primary reader | Update cadence | Core question |
|---|---|---|---|
| Budget and cost forecast | PM, owner, executive | Weekly or monthly | Will we finish within budget? |
| Change order exposure | PM, owner, commercial lead | Weekly | How much cost is pending a decision? |
| Schedule and milestones | PM, superintendent, owner | Weekly | Which milestones are slipping and why? |
| Risk register | PM, project team | Weekly | Which risks need action before they become issues? |
| RFI and submittal tracker | PM, project engineer, design team | Daily to weekly | What documentation is holding up the field? |
| Weekly project report | Owner, PMO, team | Weekly | What changed this week and what is needed? |
| Executive or owner report | Executive, owner, lender | Monthly | Is the project healthy and what decisions are needed? |
| Earned value (EVM) | Project controls, owner | Monthly | Is performance on plan for cost and schedule? |
| Closeout readiness | PM, owner, facilities | Weekly near completion | What stands between us and final completion? |
1. Budget and cost forecast dashboard
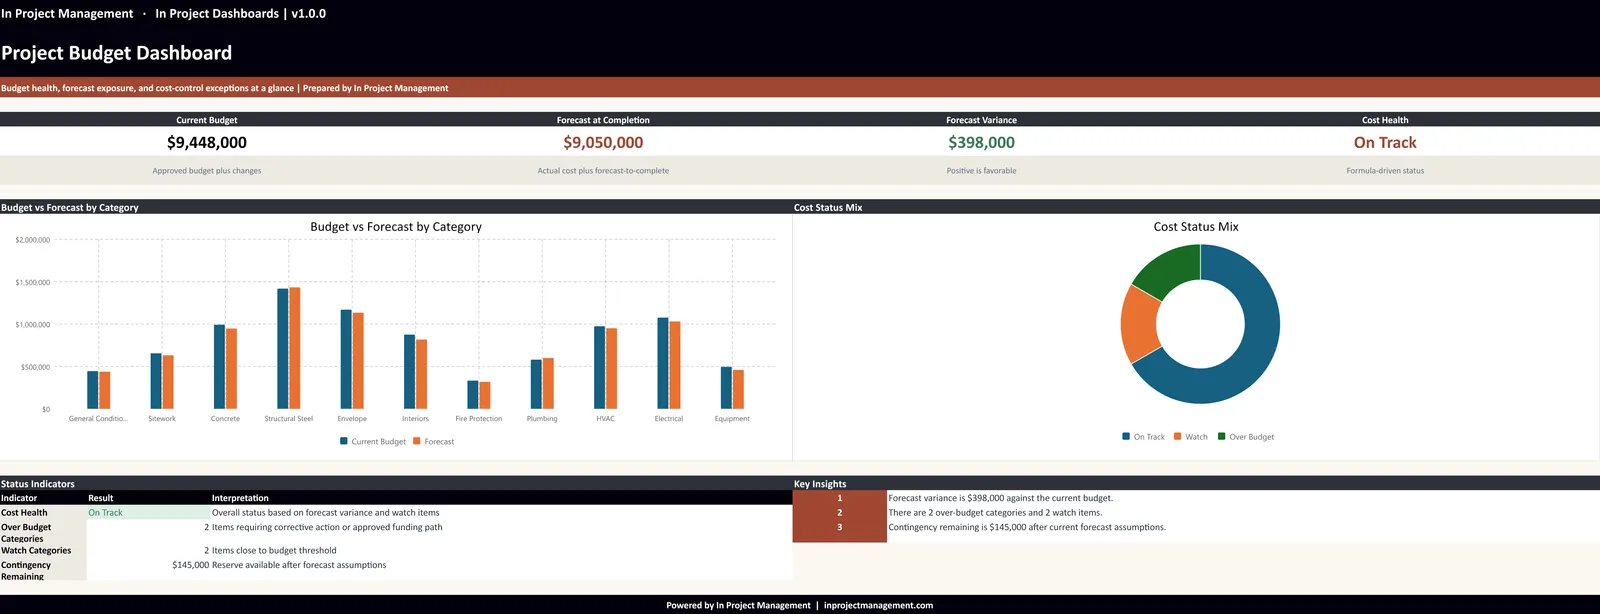
The budget dashboard is the anchor. It should show the original budget, approved changes, current budget, committed cost, actual cost to date, forecast to complete, forecast at completion (FAC), variance, and remaining contingency. The most important number is not the actual cost. It is the forecast at completion and how it moved since the last report.
KPIs to include
- Current budget (original plus approved changes)
- Forecast at completion and change since last period
- Forecast variance by cost category
- Contingency remaining and burn rate
- Number of categories over budget or on watch
Common mistakes
The most common mistake is reporting actual cost against budget without a forecast. Actual cost only tells you what has been spent. The second mistake is quietly absorbing pending changes into the forecast without labeling them, which makes the variance look better or worse than it is. Keep a visible line for pending exposure so leaders can see both the committed forecast and the risk-adjusted forecast.
2. Change order exposure dashboard
Change orders are where budgets drift. A change dashboard should show submitted value, approved value, rejected value, pending exposure, the age of each pending decision, and any schedule impact claimed. Aging matters as much as value: a $40,000 change that has waited 60 days for a decision can block procurement and turn into a schedule claim.
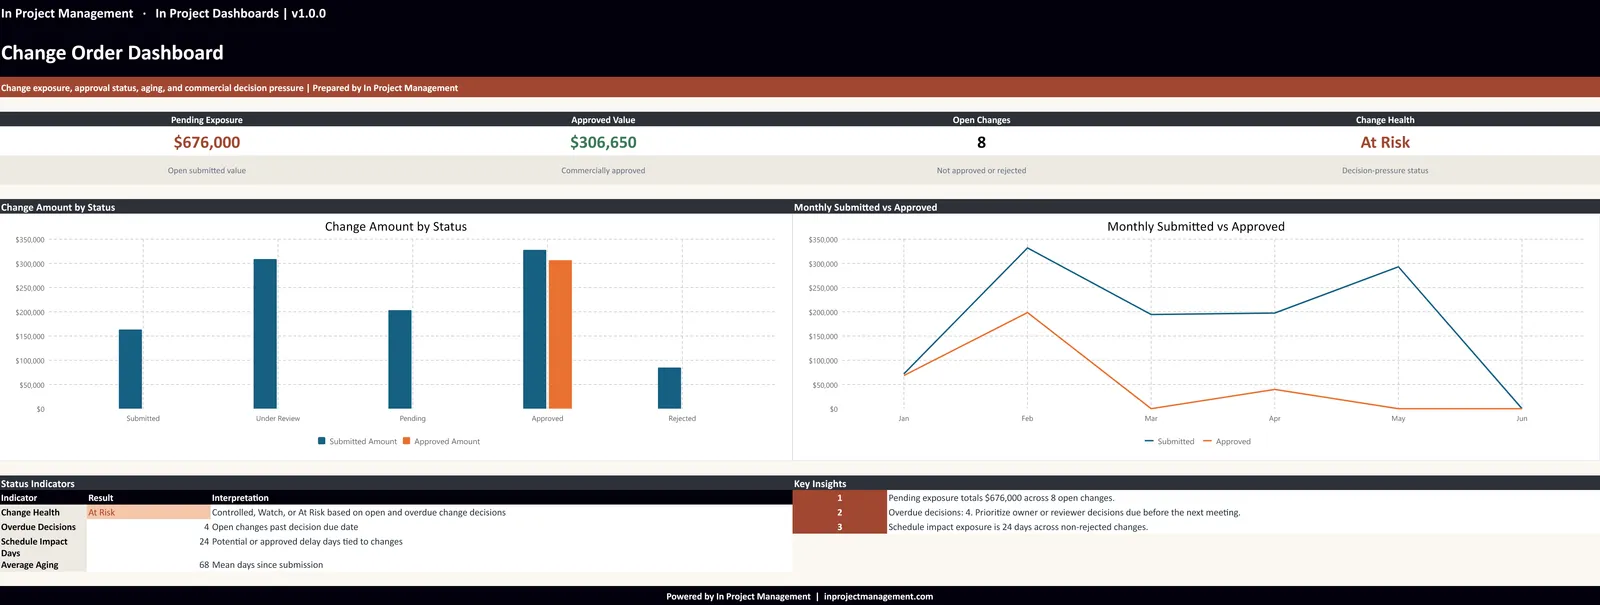
- Pending exposure in dollars and as a percent of remaining contingency
- Decision aging buckets (0 to 15, 16 to 30, over 30 days)
- Approved changes by cause: owner request, design change, unforeseen condition
- Changes with schedule impact claimed
Owners use this view to prioritize decisions. Contractors use it to show that commercial issues were raised early. Both sides benefit from one agreed log.
3. Schedule and milestone dashboard
Most project managers already have a CPM schedule. The dashboard is not a replacement for it. It is a summary that shows milestone movement, critical and near-critical activities, float trends, and the constraints holding work back. The goal is to explain why dates move, not just that they moved.
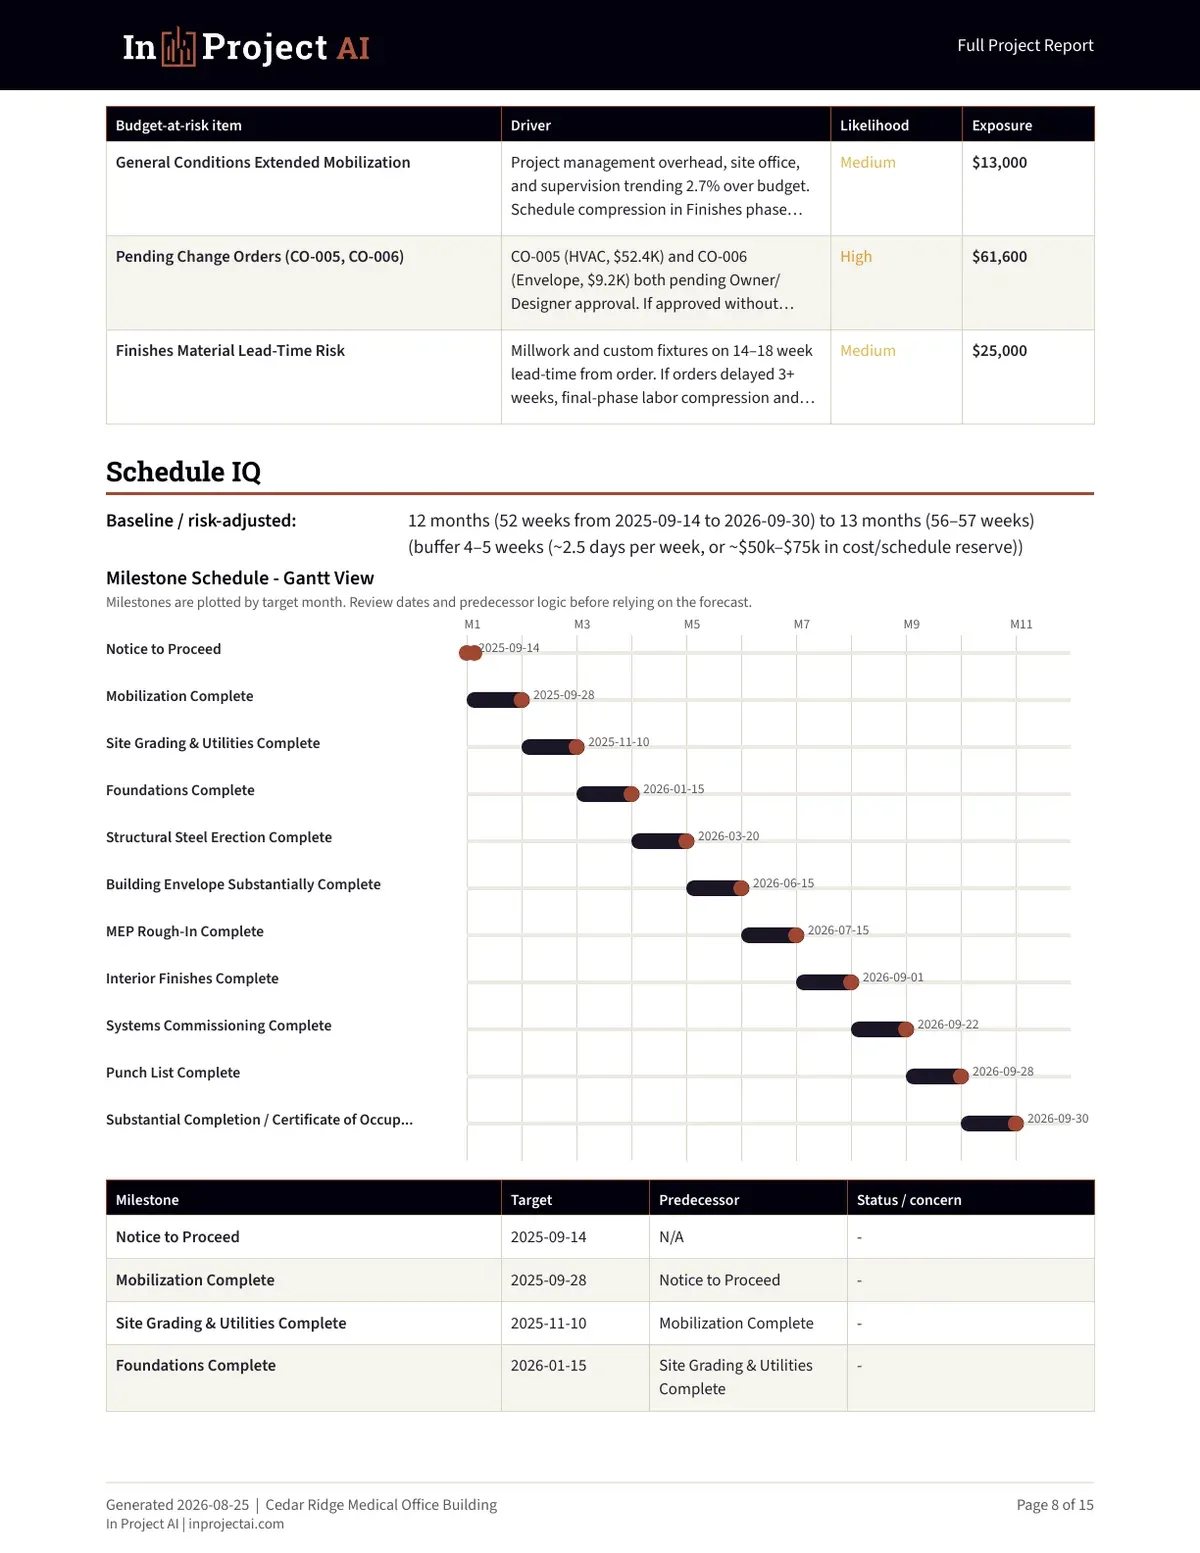
- Milestones with baseline date, current forecast, and variance in days
- Activities with negative or shrinking float
- Open constraints: RFIs, submittals, permits, inspections, long-lead materials
- Three-week or six-week look-ahead completion rate
Pair this view with the RFI and submittal tracker. Many schedule slips start as a late document, not a slow crew.
4. Risk register dashboard
A risk register only works if it drives action. The dashboard should show open risks by severity, overdue mitigation actions, risk owners, and which risks are trending up. Scoring is useful, but ownership and due dates are what turn a list of worries into a managed process.
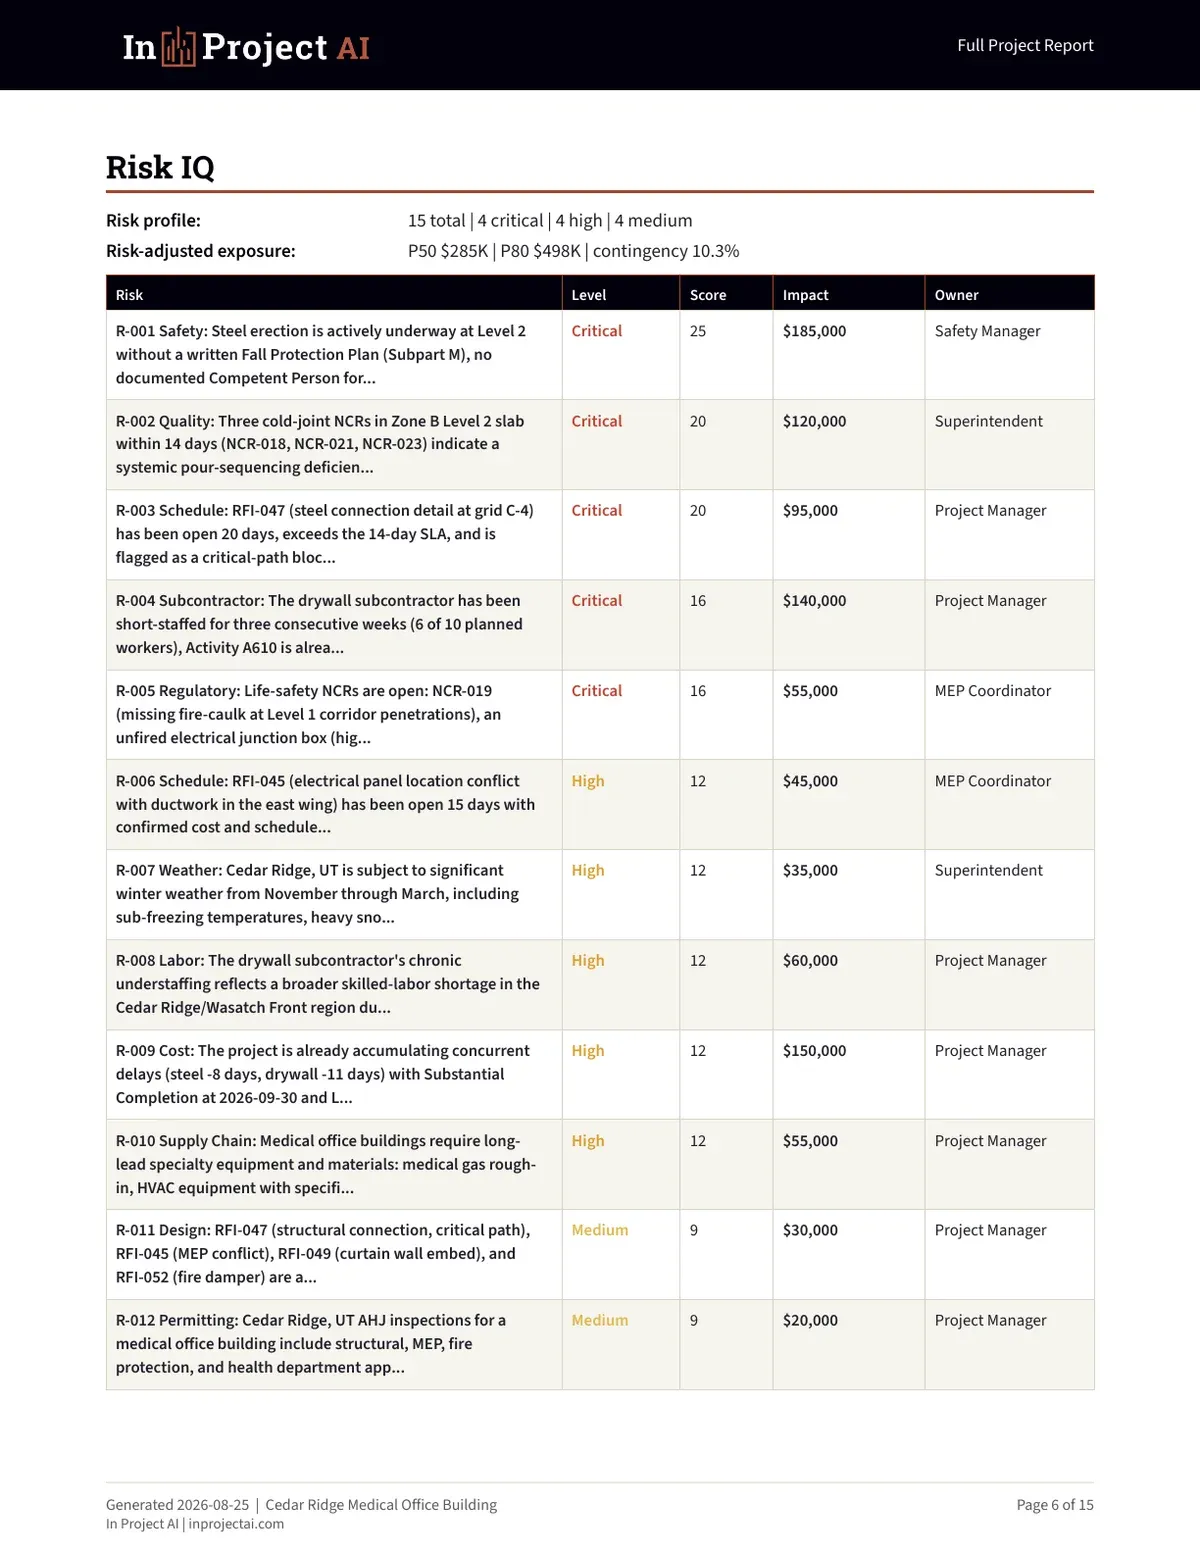
- Open risks by severity (critical, high, moderate, low)
- Overdue mitigation actions and their owners
- Risks trending up since the last review
- Top risks with cost or schedule exposure estimates
Review the top five risks in every weekly meeting. If the same risk sits at the top for a month with no change in mitigation status, the register has become paperwork.
5. RFI and submittal tracker
Document control delays are one of the most common hidden causes of schedule slip. An RFI and submittal tracker should show open items, overdue items, aging buckets, the responsible party, required dates, and which items affect critical work or long-lead procurement.
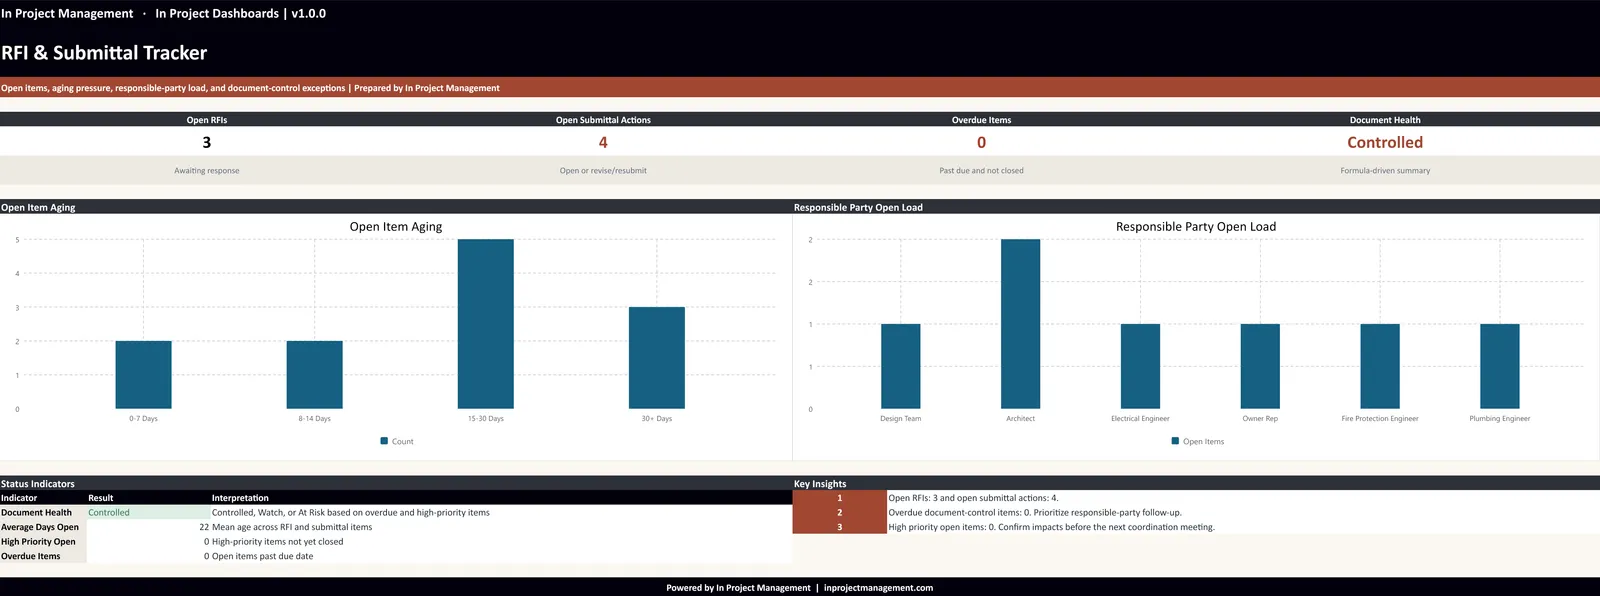
- Open RFIs and average days open
- Submittals in review, revise and resubmit, and overdue
- Items by responsible party (design team, owner, trade partner)
- Items tied to long-lead materials or critical activities
The single most useful field is the required-by date tied to the schedule. Without it, every RFI looks equally urgent.
6. Weekly project report dashboard
The weekly report is where the other dashboards come together. It should summarize overall status, progress against plan, budget and schedule status, top risks and issues, decisions needed, and the open controls items that need follow-up. Keep it to one page whenever possible.
- Overall status with a one-sentence explanation
- Percent complete versus planned
- Budget and forecast movement this week
- Top three risks and issues with owners
- Decisions needed from the owner or design team, with due dates
The weekly report fails when it becomes a narrative of everything that happened. Owners want to know what changed, what it means, and what they need to decide. For a step-by-step template, see how to create a weekly project report.
7. Executive and owner report
Executives and owners need fewer numbers and more judgment. An executive view should show project health, risk-adjusted exposure, confidence in the data, projected schedule slip, the top concerns, and recommended decisions for this period.
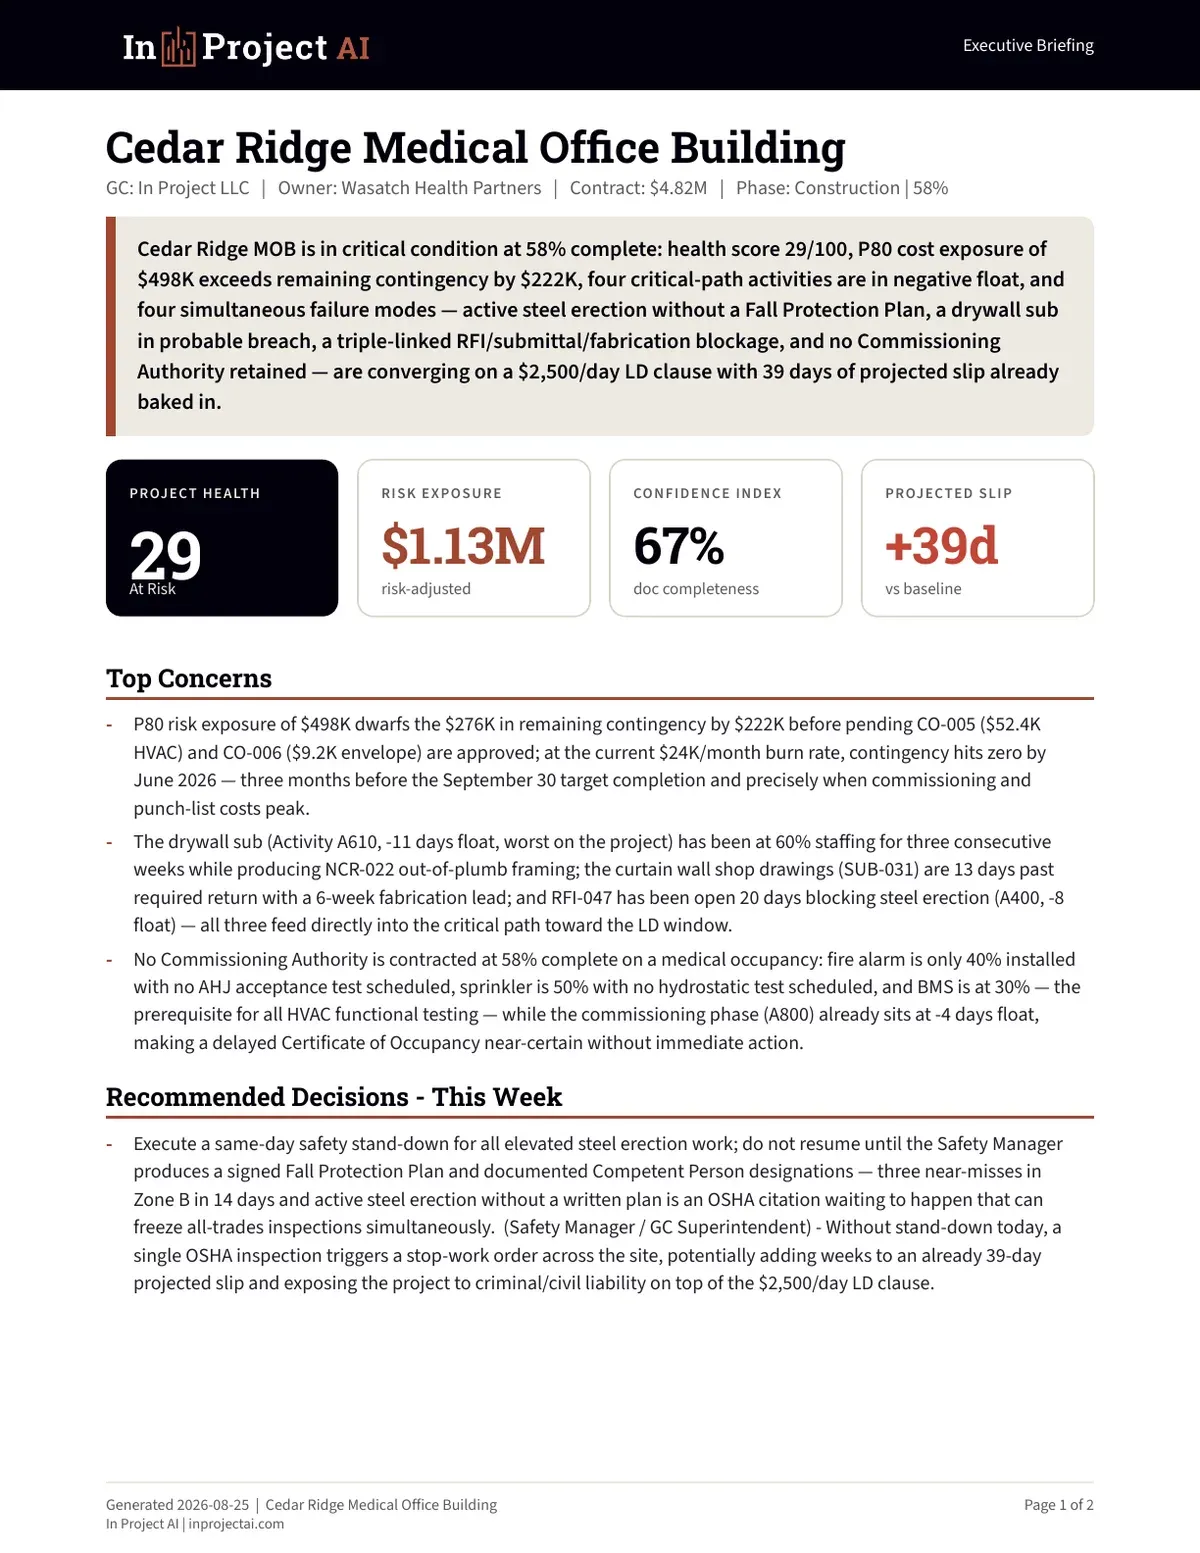
Notice what the example does well: it leads with a short summary in plain language, quantifies exposure, and ends with decisions, owners, and the consequence of waiting. That structure is more useful to an owner than ten charts.
8. Earned value (EVM) dashboard
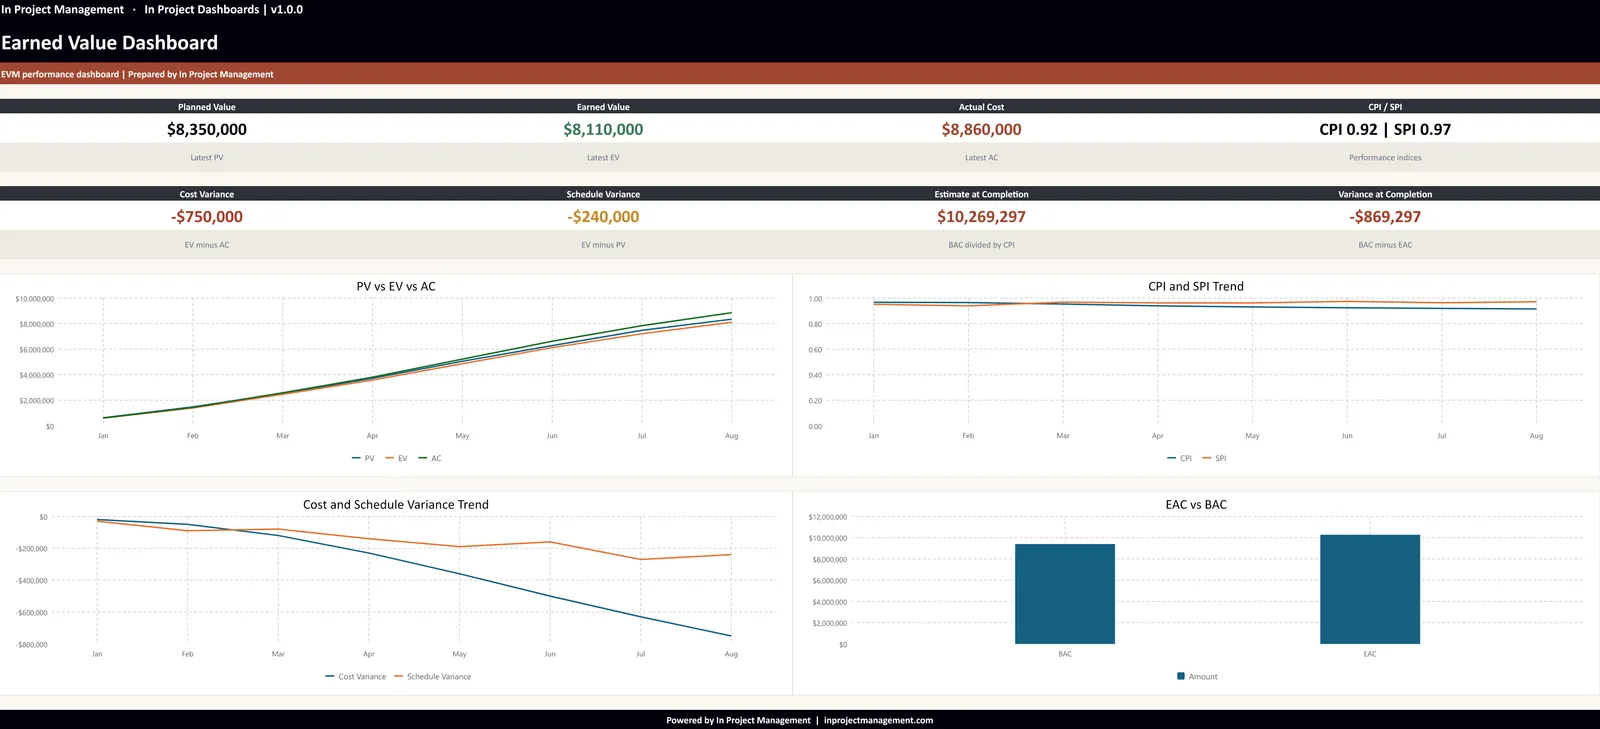
Earned value management compares the value of work completed with what was planned and what it actually cost. It is the most objective way to see whether a project is ahead or behind on cost and schedule at the same time, and it is standard on many public and owner-controlled programs.
| Metric | Formula | How to read it |
|---|---|---|
| Cost variance (CV) | EV minus AC | Negative means over cost for the work done |
| Schedule variance (SV) | EV minus PV | Negative means less work done than planned |
| Cost performance index (CPI) | EV divided by AC | Below 1.0 means each dollar buys less than a dollar of work |
| Schedule performance index (SPI) | EV divided by PV | Below 1.0 means behind plan |
| Estimate at completion (EAC) | BAC divided by CPI | Projected final cost if current efficiency continues |
In the example above, earned value of $8.11M against actual cost of $8.86M gives a CPI of about 0.92, and against planned value of $8.35M an SPI of about 0.97. The project is spending more than planned for the work completed and is slightly behind. That is a conversation to have now, not at the end of the job.
9. Closeout readiness dashboard
Closeout is where many projects lose weeks. A closeout dashboard tracks punch list items by trade, closeout documents, warranties, operations and maintenance manuals, attic stock, training, inspections, and final approvals. It should show what is complete, what is late, and who owns each remaining item.
- Open punch items by trade and by area
- Closeout documents received versus required
- Inspections and certificates outstanding
- Owner training and turnover sessions scheduled
Start this dashboard at least 60 to 90 days before substantial completion. Turnover goes faster when the list exists before the building is finished.
How to build these dashboards without a data team
You do not need a business intelligence platform to start. Most teams can build reliable dashboards from the logs they already keep.
- Pick the source of truth for each metric. The cost report, the schedule, the RFI log, and the change log should each have one owner.
- Standardize the inputs. Use consistent statuses, dates, and cost codes. Most dashboard errors are input errors.
- Set a weekly controls cycle. Update logs early in the week, review exceptions, then publish the report.
- Start in a spreadsheet, then automate. Excel or Google Sheets is enough to prove the format. Move to Power BI, your project management platform, or an AI-assisted tool once the inputs are stable.
- Review the dashboard in a meeting. A dashboard nobody discusses is a decoration.
Tools like In Project AI can shorten this process by reading the schedules, budgets, RFI and submittal logs, change logs, and daily reports you already export and producing the budget, risk, schedule, and owner-report views in one run. Professional review is still required before anything goes to an owner.
Common dashboard mistakes to avoid
- Showing actual cost without a forecast at completion.
- Mixing approved changes, pending changes, and potential risks in one number.
- Using red, yellow, and green without written thresholds.
- Tracking dozens of KPIs instead of the five that drive decisions.
- Building a dashboard that requires manual re-entry of data that already exists in another log.
- Publishing on an irregular schedule, which teaches readers to stop trusting the numbers.
How In Project helps
In Project LLC helps construction teams set up practical project controls and reporting. Our consulting work focuses on clean logs, clear ownership, and reports owners actually read. In Project AI turns the documents you already have into risk registers, budget forecasts, schedule concerns, and owner-ready reports. You can review a real sample report before uploading any project data, or contact us about a project controls review.
Frequently asked questions
What should a construction project dashboard include?
At minimum: budget and forecast at completion, pending change exposure, milestone schedule status, top risks with owners, open and overdue RFIs and submittals, and the decisions needed this period. Everything else is optional until those are reliable.
How often should construction dashboards be updated?
Most project dashboards should be updated weekly. Executive and earned value views are usually monthly, and RFI and submittal trackers are often reviewed daily on active projects.
What is the most important KPI for a construction project manager?
Forecast at completion compared with the current budget, together with how it moved since the last report. It combines cost performance, approved changes, and known exposure into one number leaders can act on.
Can I build construction dashboards in Excel?
Yes. Excel or Google Sheets is enough for most single projects if the source logs are clean and updated on a fixed cadence. Teams usually move to Power BI or an AI-assisted tool when they manage several projects or want to reduce manual work.
What is a good CPI or SPI on a construction project?
A CPI or SPI of 1.0 means the project is exactly on plan. Values below 1.0 mean over cost or behind schedule. Many teams treat anything below 0.95 as a trigger for a recovery plan, but thresholds should be agreed with the owner.